


Asset Allocation
Context and asset classes
The FRR was entrusted by the legislator with the mission of “managing the funds allocated to it, in order to build up reserves to help ensure the sustainability of eligible pension schemes”. In this context, the FRR has implemented an asset allocation strategy aimed at optimising the risk-return ratio of its portfolio, in compliance with regulatory constraints and the horizon of its commitments.
Pursuant to Article L. 135-8 of the Social Security Code, the FRR’s investment horizon is now a short horizon, with €2.1 billion paid to CADES each year in accordance with the legislator’s commitments.
The FRR’s total assets amounted to €26.0 billion as of December 31, 2024.
Since its creation in 2004 and until end 2024, the FRR has paid a total of €28.7 billion to CADES and €4.5 billion to CNAV.
Objectives and Constraints
Generate performance
long-term performance while limiting the negative effects of short-term market downturns
Meet its commitments
Be able to make its annual payments of €2.1 billion to CADES. The Fund’s proper operation must be preserved.
Risk diversification
Under its prudential framework, the FRR must spread its investments in a diversified manner.
Portfolio structure
Performance assets
These are assets with higher but more volatile returns. They include listed equities from developed and emerging countries, private equity, unlisted infrastructure investments and unlisted real estate.
Liability hedging assets
These are assets whose purpose is to cover the annual payment of €2.1 billion to CADES. They comprise OAT and OATi bonds held to maturity.
Fixed income assets
A diversification portfolio invested in government bonds, Investment Grade credit bonds and High Yield bonds. These bonds are managed through delegated management mandates or through fund investments.
The detailed composition of the FRR portfolio is presented in the FRR annual report.
Asset allocation optimisation process
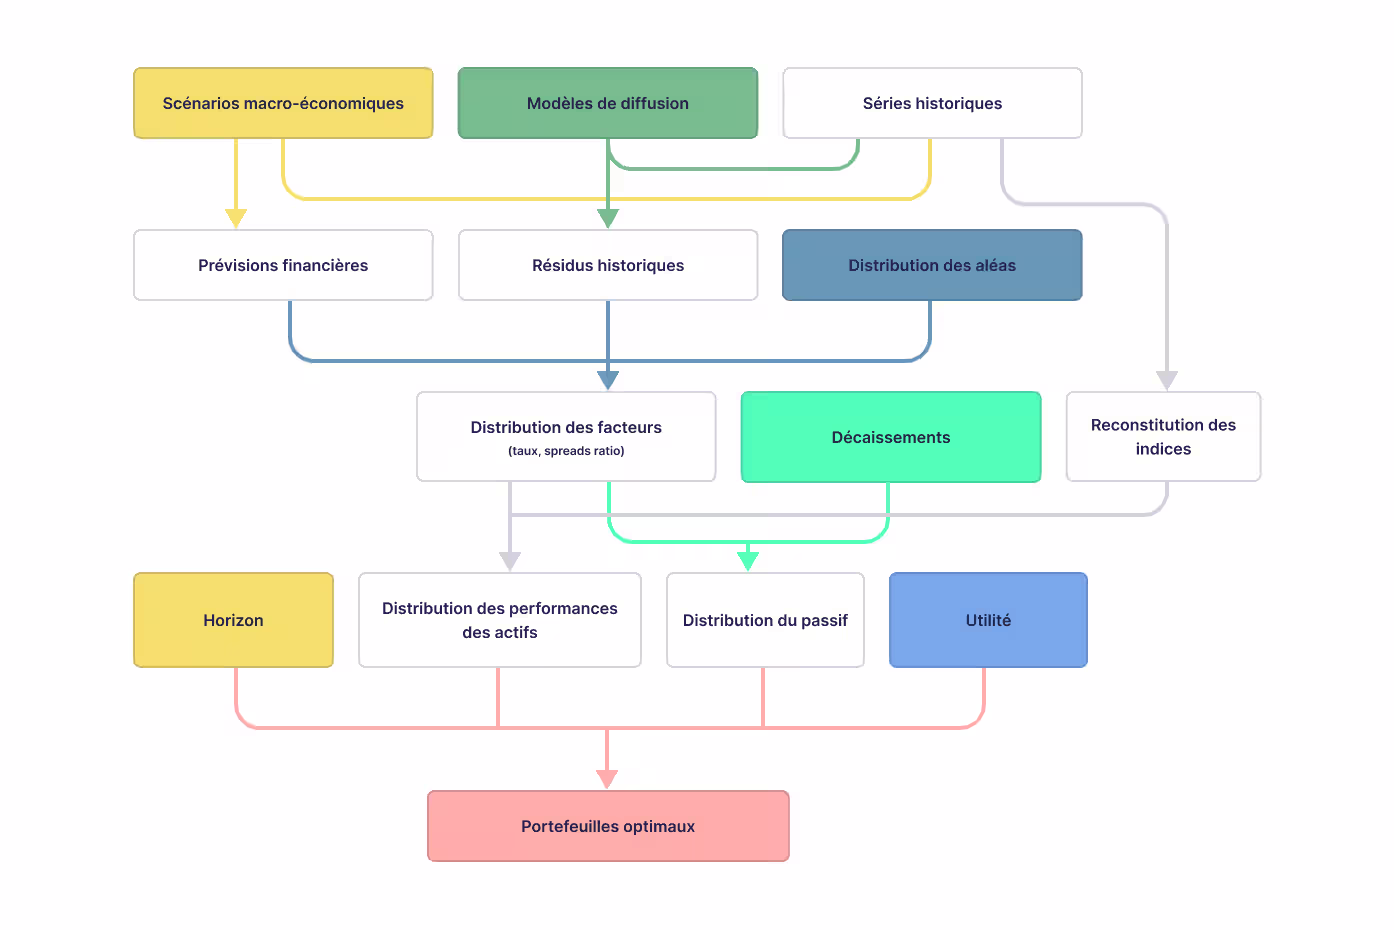
The FRR relies on an optimisation process to determine the strategic allocation that offers the best risk-return ratio for the portfolio. This process is based on liability modelling (the FRR’s commitments), the definition of return and risk assumptions for each asset class, then constrained optimisation.
The strategic allocation is proposed by the Executive Board and approved by the Supervisory Board. It is reviewed periodically in light of market developments and FRR commitments.
Portfolio weights
| End 2023 | End 2024 | |
|---|---|---|
| Performance assets | ||
| Developed market equities | 31.7 % | 32.3 % |
| Emerging market equities | 5.6 % | 4.3 % |
| Private equity | 3.1 % | 3.7 % |
| Unlisted infrastructure | 1.1 % | 1.2 % |
| Unlisted real estate | 0.1 % | 0.1 % |
| Subtotal Performance assets | 41.6 % | 41.6 % |
| Liability hedging assets | ||
| OAT and OATi | 31.6 % | 30.2 % |
| Subtotal Liability hedging | 31.6 % | 30.2 % |
| Fixed income assets | ||
| Investment Grade bonds | 12.2 % | 13.8 % |
| High Yield bonds | 5.8 % | 5.2 % |
| Private debt | 4.9 % | 5.0 % |
| Subtotal Fixed income | 22.9 % | 24.0 % |
| Cash | 3.9 % | 4.2 % |
| Total | 100 % | 100 % |


